

Everywhere we look around, there is data, data, and more data! Big data, data scientists, and data mining have started to make their presence felt at the top of the Google searches and blog headlines.
There’s a reason for this…
In every industry, today's business leaders have discovered that business intelligence tools are one of the best ways to employ their data most effectively.
This is where business intelligence systems come into the picture.
Now you might ask, but Vivek "What is business intelligence?", "What are the different business intelligence tools?" and "Which ones are the best BI tools?"
Don't worry; in the forthcoming paragraphs, I will provide you with comprehensive information about business intelligence tools, known as BI tools, and the best BI tools.
So, let's get started.
Table of Contents
What Is Business Intelligence?
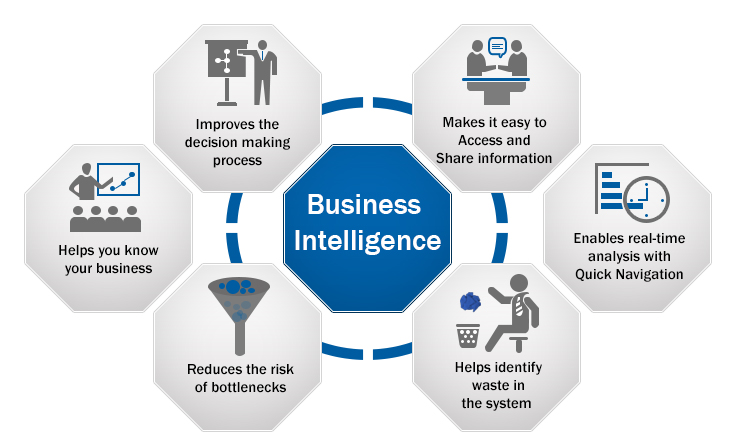
Business Intelligence (BI) integrates the employment of technologies like software and applications to accumulate data, integrate, analyze it, and then present it in reports and visual forms like pivot tables, charts, and graphs.

( Image Source )
Today, almost all businesses are well-aware of utilizing business intelligence as it assists in:
- Enhancing business decision making
- Transforming data into usable information
- Enhancing efficiency
- Boosting sales and marketing intelligence
- Improved return on investment (ROI)
- Predicting future performance
Now that we have looked at BI, we will divert our attention to the definition of business intelligence tools in the next section.
What is Business Intelligence Tools?
Business Intelligence tools are software that accumulates, transforms, and presents data to help decision-makers make informed decisions that drive business growth.

These BI tools intake large chunks of structured and unstructured data from different sources and generate leads. Then they transform it and assist in deducing actionable business insights from the data available.
As promised, let's now divert our attention to some of the top business intelligence tools for making strategic decisions.
Top 10 Business Intelligence Tools For Making Strategic Business Decisions
Selecting the best business intelligence tools for your business can be a difficult task. I know this fact very well, so I have compiled a list of the industry's best BI tools.
For your ready reference, I have given a brief description of each business intelligence tool along with its salient features to make it easier for you to make the final decision.
Now let's get started.
1. Microsoft Power BI
Overview
Microsoft Power BI is a powerful web-based or on-premises business intelligence software. The good thing about this software is, it specializes in business analytics. It consists of five unique products that offer enhanced levels of services. Each product has the power to transform data and explores and scrutinizes data, whether it is on-premise or in the cloud.
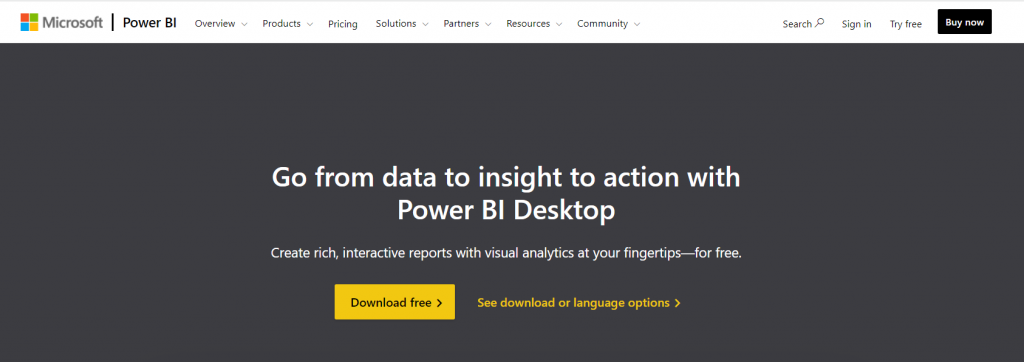
( Image Source )
All the products consist of customized dashboards and interactive reports. The Power BI software connects to your data sources to provide real-time analytics. You can also opt for Power BI Pro and Power BI Premium contingent upon your enterprise requirements. The target audience for this Microsoft BI tool ranges from small to large companies.
Features
- Gives you the scope to export reports for collaboration with others
- Comes in the form of five platforms, including Power BI, Power BI Pro, Power BI Premium, Power BI Mobile, and finally, Power BI Report Server
- Connects all data sources, from on-premises to in the cloud
- Creates real-time visualizations accessible across all devices
- Enables access through web and mobile devices
- Enables shifting to more intensive suite products as the enterprise expands
- Provides a web-based intelligence platform solution that specializes in analytics
- Provides solutions for large companies of all sizes in diverse industries
- Stores information in a centralized cloud location
To get started with Microsoft BI for free, click here.
2. Sisense
Overview
Sisense is a web-based, end-to-end business intelligence platform. Its BI software stack encompasses everything from the database through ETL and analytics to visualization. The BI tool claims its In-Chip database engine is swifter than even the in-memory databases. It is well-renowned for embedded BI uses.
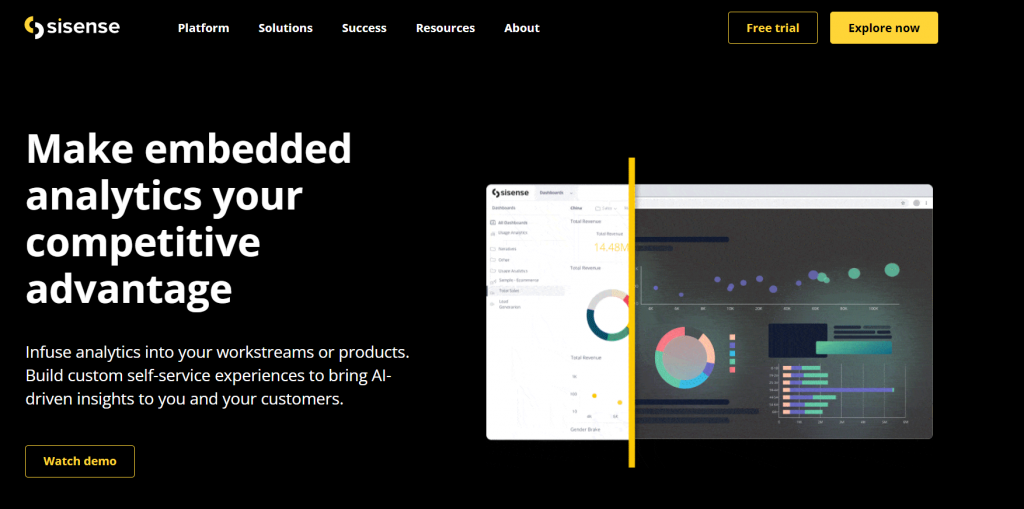
( Image Source )
Its latest version integrates new machine learning capabilities. Sisense is available on-premises or in the cloud. You even get solutions for finance, marketing, sales, HR & IT, customer service, and operations & logistics departments. Sisense makes it possible to provide analytics tools to users outside the enterprise by embedding them in web applications.
It comes with real-time data feeds, intuitive dashboards, and reports. The good news is, that you do not need any specialized user training to get started with it.
Features
- Ability to create advanced analytics
- Comes with the option of on-premise or cloud installation
- Enables access through web and mobile devices
- Integrates data from different sources
- Offers an end-to-end business intelligence solution
- Provides insight and visualizations across platforms and devices
- Provides interactive dashboards with real-time data
- Scalable for the increase in users and datasets
- Simplifies workflow creation
- Targeted towards enterprises of all sizes, across diverse industries
- Utilizes a proprietary chip to drive quick data analysis
- You do not need any specialized training
To start your free trial of Sisense, click here.
3. Datapine
Overview
Datapine is one of the best business intelligence software that has made data analysis and visualization easier for any business. Irrespective of the company's size, Datapine provides power and flexibility in equal proportions to visualize data in the most professional manner.
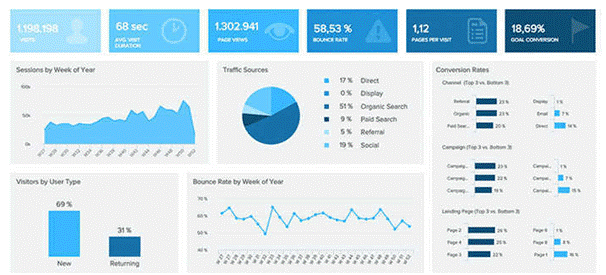
( Image Source )
This software allows the business to accumulate scattered data and combine them for better visualization and sharing. With the help of Datapine, companies can discover a new relationship and detect the current trend of the work process.
Features
- Aids in publishing/sharing
- Comes with visual analytics
- Comprises of Ad Hoc reports and dashboards
- Consists of performance metrics
- Easy to conduct profitability analysis and maintain scorecards
- Helps in benchmarking key performance indicators using predictive analytics
- Indicates trends/problems
- Perform strategic planning
For 14-Days free trial of Datapine, click here.
4. SAS Business Intelligence
Overview
SAS Business Intelligence is a software solution that provides different products and technologies for text analysts, data engineers, data scientists, forecasting analysts, econometricians, optimization modelers, etc. Its most popular offering is its advanced predictive analytics. It even provides an excellent business intelligence platform.
( Image Source )
With its help, you can leverage data and metrics to make informed decisions about your business. It also consists of a set of APIs that provide lots of customization options. This way, SAS assures high-level data integration and advanced analytics & reporting.
Features
- Comes with exciting features and text analytics enabling you to get insights from data text like social media and location analytics that combine data in a geographical context
- Comprises of dynamic visuals organized into interactive reports and dashboards which can be accessed on mobile and tablet devices (both Android and iOS)
- Gives you the chance to integrate SAS with Microsoft Office applications like Word, SharePoint, PowerPoint, or Excel with other Office Analytics solutions enabling you to see results directly in Microsoft Office Suite
- Offers automated analysis supported by machine learning compiled in interactive visualizations to answer business questions like "Where do my customers come from?"
- Provides different BI products and technologies focused on visual data and exploration and effortless analytics, interactive reporting and dashboards, collaboration, and mobile apps
Free trial for 30 days of SAS Visual Analytics and SAS Visual Statistics, click here.
5. Oracle BI
Overview
Oracle BI includes a comprehensive range of enterprise business intelligence functionality with capabilities like full ad-hoc, dashboards, alerts, proactive intelligence, etc.
It provides an integrated, end-to-end Enterprise Performance Management System. It comprises an integrated query, analysis, data integration, reporting, and management tool.
Features
- Blends with all types of local and corporate data
- Comprises of centralizing data models and metrics for the all-inclusive representation of business
- Connect directly to more than one Oracle source and Big Data for broader, richer analysis
- Create mobile analytical apps without writing any code
- Empower key decision-makers to find answers to predictive and statistical questions swiftly
- Enables business analysts to generate mash-up data sets by running R scripts in batch mode
- Enables creation of story around any business using visually stunning analytics
- Enhance performance for mash-up data
- Get exclusive insights by creating rich data mash-ups
- Provides hundreds of pre-built functions to quicken analysis with R scripts
- Quicker query performance
- See, scrutinize, and modify data in the cloud or on-premises
- Simplify analytics strategy using a single integrated platform
To try Oracle Cloud for free, click here.
6. MicroStrategy
Overview
MicroStrategy is one of the best business intelligence tools that provide high-speed dashboarding and data analytics. It even aids in monitoring trends, recognizes new opportunities, enhances productivity, etc.
( Image Source )
It lets users connect to one or various sources, whether the incoming data is from the spreadsheet, cloud-based, or enterprise data software. You can also access it from your desktop or mobile devices. It provides advanced and predictive analytics to make well-informed business decisions.
Features
- Comes with a real-time WYSIWYG report design
- Comprises of advanced and predictive analytics
- Comprises of Big Data solutions
- Consists of business intelligence
- Contains scorecards and dashboards
- Contains self-service analytics
- Effortless to use and maintain
- Gives you the ability to use enterprise reporting
- It is a high-performance business intelligence tool
To start using MicroStrategy, click here.
7. Tableau
Overview
Tableau is one of the most influential business intelligence tools that comes with self-service analytics. Its specialization lies in analyzing and presenting data using dashboards, reports, and visualizations. You can install it on-premise, public cloud (employing Tableau server), or online (Tableau Online).
( Image Source )
It provides intuitive, self-service analytics for users without requiring any technical knowledge to get started. You can integrate data using different sources, which creates real-time visualizations using this BI tool within seconds.
Features
- Aids you in accumulating data from various sources, either on-premise or from the cloud
- Comes with four different platform choices, including Desktop, Browser, Mobile, and Embedded
- Creates real-time visualizations in a few clicks
- It delivers intuitive self-service analytics for users without requiring any technical knowledge
- Option to employ on-premise, public, and fully hosted business intelligence solutions
- Provides solutions for enterprises of all sizes across diverse industries
- You can install it on-premises, public cloud, and Tableau cloud
To opt for a 14-day free trial of Tableau, click here.
8. Yellowfin BI
Overview
Yellowfin BI is a business intelligence tool that provides end-to-end analytics employing visualization, machine learning, and collaboration. It also enables you to effortlessly filter through tons of data with the aid of intuitive filterings like radio buttons and checkboxes.
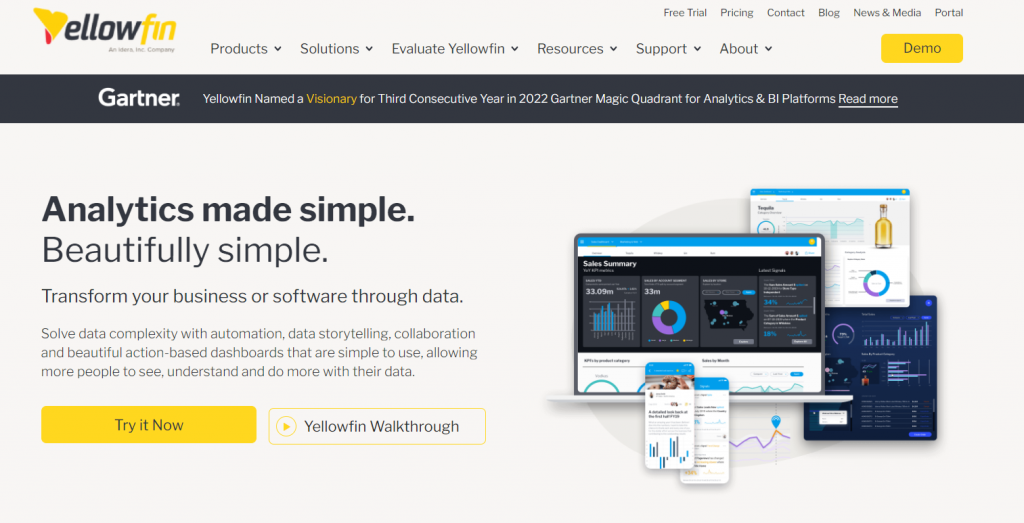
( Image Source )
You can open up dashboards just about anywhere, thanks to the flexibility of this tool when it comes to its accessibility (mobile, webpage, etc.)
Features
- Allows you to access the dashboard from anywhere, including web page, company intranet, wiki, or mobile device
- Also supports the business decision-making process
- Enables quicker, smarter collective decision-making
- Gives you the option to map mobile BI like features that aids users to access and monitor business-related data
- Utilizes data-rich presentations and interactive reports to make user's insights effective
To request a live demo of Yellowfin BI, click here.
9. Zoho Analytics
Overview
Zoho Analytics is a business intelligence tool that is handy to conduct comprehensive reporting and data analysis. This BI software consists of automatic data sync, and you can schedule it periodically. You can employ it to build a connector by utilizing the integration API's effortlessly.
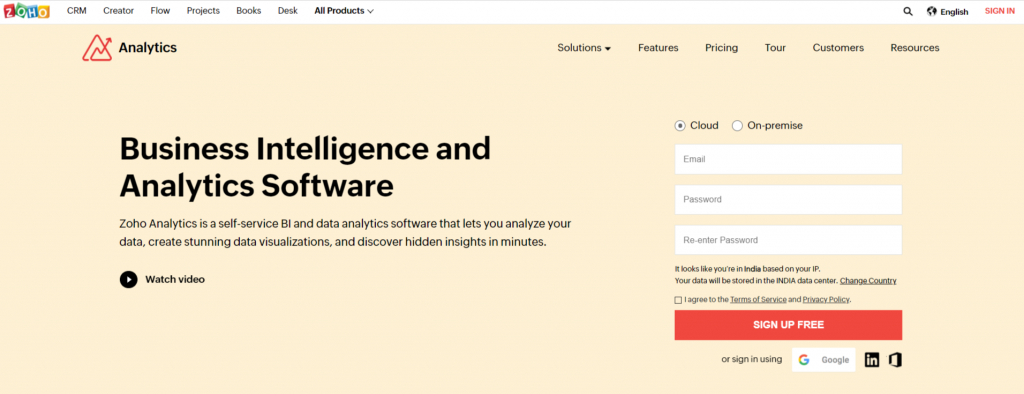
( Image Source )
It allows you to merge data from multiple sources, which aids in creating meaningful reports. Thanks to its easy editor, you can create personalized reports and dashboards that enable you to check out critical details.
Features
- Comes with a wide range of visualization options like pivot tables, summary views, charts, custom themed dashboards, and KPI widgets
- Comprises of 100+ readymade connectors for popular business apps, databases, and cloud drives
- It is unified business analytics for scrutinizing data from different business apps
- Provides white label BI portals and embedded analytics solutions
- Utilizes augmented analytics by employing ML, AI, and NLP
To start your 15-days trial period of Zoho Analytics, click here.
10. IBM Cognos
Overview
IBM Cognos is a cloud-based business intelligence and analytics platform. You can employ its web-based proprietary tools on-premise or in the cloud.
This BI software imports data from a wide array of sources. Its built-in AI recommendations guide users in data preparation and insights. This, in turn, assists in creating interactive visualizations, dashboards, and reports.
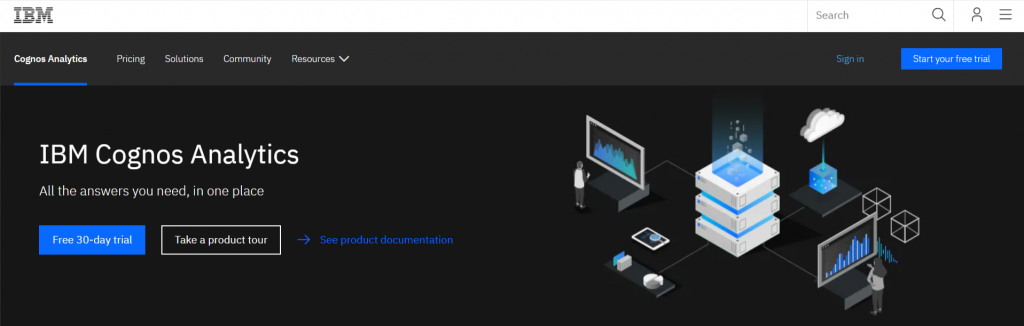
( Image Source )
It enables access to content through email, Slack, and the web. This way, you can conveniently share information with your teams. Its target users are enterprises in diverse industries and range from small to large businesses.
Features
- Ability to share reports and dashboards with the help of a web page
- Aids in creating interactive dashboards, visualizations, and reports using AI recommendations
- Comes in the form of a cloud-based business intelligence and analytics solution
- Employs machine learning to access and combine related sources
- Enables access to on-premise or cloud
- Imports data from all types of sources
- Provides solutions for enterprises in diverse industries
- Shares visualizations through Slack or email
- Users are required zero specialized skills to get started
- You can install it on-premise or in the cloud
To start your free 30-day trial period of IBM Cognos, click here.
Now that we have looked at the BI tools for making strategic decisions, it's the right time to understand why it becomes essential for companies to use Business Intelligence Tools.
Why it Becomes Essential for Companies to Use Business Intelligence Tools?
Business Intelligence (BI) software is a vital investment for any business. Many of you might be wondering, "Why do we need Business Intelligence tools?"
To justify this expense, decision-makers need to look at the bigger picture.
Business intelligence integrates a company's most vital data, making it easier for employees to concentrate on answering crucial questions. With access to data, you can make a swift decision and gain your competitors' upper hand.
Also, the dashboards and reports created by BI tools can have a magnanimous effect on your business.
Here are some of the benefits that you can benefit from by utilizing business intelligence tools.
1. Employees are empowered to enhance the bottom line
When professionals have access to the information they need, it aids them to focus on improving their work. This is extremely critical for them to make a real impact on what matters most for their position.

The data-driven approach also opens up opportunities for new incentives by rewarding how an employee can enhance their bottom line beyond expectations.
2. Lasting change happens from the bottom-up instead of top-down
It has been widely known that top-down change is only essential for companies during crucial moments, while bottom-up brings long-term improvements.
With the help of BI tools, companies can perform intelligent analysis that is guided by the bottom line.
As data gets entered into the system, dashboards across different roles depend on the information required while the same results connect employees.
In certain organizations without centralized reporting, it results in decisions made on false assumptions. However, when you employ BI tools, everyone shares a single source of truth.
3. Reduces stress on managers to micromanage
Instead of micromanaging details that transform into success, you can outline the parameters for success and let employees meet expectations. Managers can reduce the stress by clearly outlining the tasks to be performed well. Then the employees take accountability in a more transparent environment.
4. Data improves conversations by concentrating on facts instead of subjective experiences
The best decisions are those that a group makes by weighing in each other's potential.
While going through the discussion period, it becomes significant to have data that support each argument.
In case the decision-makers are taking a call that can profoundly impact the company, the outcome mustn't be totally based on a single event's subjective experience.
Instead, during such calls, you need to take the data into account so that the real picture comes into account instead of employees' perspectives.
5. Businesses have the opportunity to test actions repeatedly
When a business makes a substantial change, the result can sometimes get lost. However, companies can keep track of the critical metrics for analysis regarding business intelligence tools.
Instead of driving in for a change, the company can test changes carefully in a controlled environment. This way, the data can reflect whether they were successful before they hurt the bottom line.
6. Business intelligence assists you in gaining a competitive edge over the rest
( Image Source )
Business intelligence is a global phenomenon.
Globally businesses are employing intelligent reporting tools to get a step ahead of their competitors.
As globalism becomes an increasing economic trend, enterprises of all sizes will feel the regional effects BI has when a market is cornered.
To keep up with this accelerating change, many might feel the need to improve internally to compete with the unexpected.
These are some of the reasons that make business intelligence tools essential for companies on a global scale.
Future of BI Tools
These are some of the top business intelligence tools for making strategic business decisions.
However, as years roll by, it will become evident that business intelligence tools would become critical for businesses success.
It seems that we will see the BI tools become more collaborative, proactive, insightful, and equipped to handle Big Data in the near future.
For more insightful blogs on cutting-edge technology, keep a close eye on this space!


Leave a Reply