

Black Friday, the ultimate shopping showdown, is fast approaching. Besides being a big day for shopping lovers, it's also a high-stakes test for your IT strategy. In 2022, the global online sales hit a staggering $1.14 trillion during the holiday season.
That's not all - online retail sales during Black Friday in the US alone skyrocketed by approximately 10% to $17.2 billion. As millions of shoppers flock to online stores during the holiday season, the sudden increase in traffic can take your business to new heights or expose gaps in your IT strategy.
To help you ensure the former, we will explore the challenges of holiday traffic and how observability tools can manage them in this blog.
1. The problem with holiday traffic
Wondering what exactly the problem with holiday traffic is? Think of it this way - during the holiday season, especially Black Friday, there's a sudden surge of traffic on your platform. The consequences are endless if your application is not optimized to handle the surge.
Anything can happen, from slow website performance and increased load time to site crashing and damage to your reputation. Let us discuss some of them in detail.
- Cart abandonment rate: On average, the cart abandonment rate during Black Friday is 78% globally. This can be due to slow performance or increased load times.
- Customer experience: Slow-loading pages or site downtime can easily frustrate your customers. And a poor customer experience can easily translate to long-term customer loss.
- Security: Cyber attacks tend to increase during the holiday season. So, your platform can be more susceptible to DDoS attacks, data breaches, and fraud attempts.
You need customers to stick with you and offer them the best during holidays. But with these many problems, it can be challenging to do that. So, what's the solution?
Let's discuss this in the next section.
2. Identifying holiday season traffic blind spots with unified observability
Imagine you're preparing your platform for Black Friday. There's an overwhelming influx of users, and suddenly, your website is slowing down. Your developers are trying their best to find the issue. However, finding the issue can be like finding a needle in a haystack. Fixing it takes time, too!
Now, imagine if there's a tool that can give you a clear picture of everything that's happening behind the scenes. You have end-to-end visibility into your IT environment. However, if you use disparate tools to monitor different parts of your environment, you may get stuck with inconsistent answers.
That's where unified observability platforms can help. They detect the issue in real-time, highlight the root cause, and provide actionable insights.
They also ensure your IT team is immediately alerted to the issue and can take corrective actions. Some features of observability tools include:
- End-to-end visibility into your infrastructure, applications, and services
- Real-time data collection and analysis to detect anomalies and enable rapid responses
- Correlate data from different sources to identify root causes
- Easily scalable with your infrastructure
3. Top 5 observability tools
Here are the top 5 observability tools that can help you solve the challenges with holiday traffic:
1. Datadog
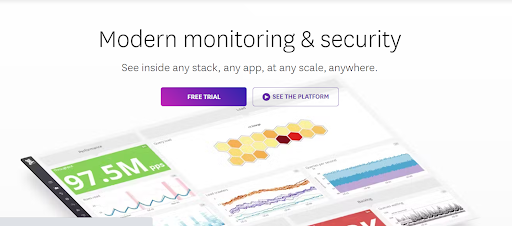
Datadog is undoubtedly among the most popular observability tools, with a market share of 49.50%. The platform enables you to detect and resolve the root cause of any issues using distributed tracing. Further, it can efficiently monitor large-scale applications, databases, tools, and services. It also supports cross-team collaboration.
Features
- Supports over 650 integrations
- Offers Quality Gates for enhanced code quality control
- Automated service mapping is available
- Enables you to search traces in real-time
- Offers reliable insights using machine learning
- Offers a centralized view of health metrics
- Severity score shows live threat activity
Pricing
The pricing for Datadog differs as per the product. For example, the Observability Pipelines are available in two plans:
- Per Ingest at $0.10 per ingested GB per month
- Per CPU at $1500 per CPU per month
2. Middleware
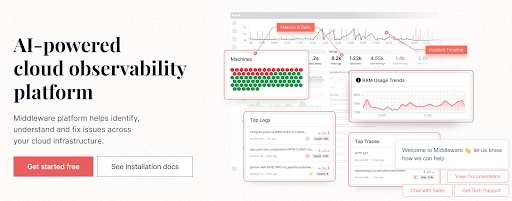
An open-source unified observability platform, Middleware helps identify and fix issues in your infrastructure. It provides real-time monitoring of metrics, traces, and logs in a unified dashboard.
But that's not all. Middleware is easily deployable and scalable in different environments such as Kubernetes. It offers single script installation, making it easy for developers to install and manage the software.
Features
- Offers on-premise data storage
- Uses synthetic monitoring for monitoring the environment and faster troubleshooting
- Works well with multi-tiered applications
- Offers full-stack application performance monitoring
- Supports 50+ integrations
- All features accessible in all plans
- Allows you to set up a data rotation policy
- Provides real-time insights into usage patterns, error rates, and more
- Complies with GDPR, CCPA, and SOC 2
- Quick installation (under 1 minute)
- 24*7 support available
- Helps you identify the root cause of any problem
Pricing
Middleware has three pricing plans - Free Forever, Pay As You Go, and Enterprise Plan. You can contact their customer care to learn more.
3. AppDynamics
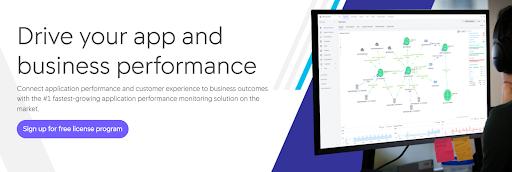
A Cisco product, AppDynamics works as an observability platform that helps you monitor, analyze, and detect issues in real-time. It was recognized as a Global Enterprise Customers' Choice on Gartner Peer Insights. Nearly 8,000 companies trust the software to optimize the performance of their platforms.
AppDynamics can be easily customized and scaled to meet your growing needs. The dashboards are customizable so that you can adjust them according to your requirements. It also provides multi-cloud support.
Features
- Can monitor applications, business performance, infrastructure, and databases
- Automatic detection of performance issues with real-time alerts
- Offers root cause analysis
- Helps in visualizing infrastructure components and digital experience of users
- Enables detection of security vulnerabilities
- Automatic anomaly identification
- AIOps-driven alerts for prioritizing and resolving the most urgent business matters
- Supports multiple languages, like PHP, Python, C++, etc.
Pricing
AppDynamics offers four pricing plans:
- Infrastructure Monitoring Plan at $6 per month
- Premium Edition at $60 per month
- Enterprise Edition at $90 per month
- Enterprise Edition For SAP Solutions at $167 per month
4. New Relic
With a market share of 23.18%, New Relic is one of the oldest players in the market. It is perfect for cross-functional teams looking to prevent and detect problems and troubleshoot faster.
The software shows metrics, traces, logs, and events in a unified platform to enhance the performance of applications and infrastructure. It enables better identification and prioritization of errors.
Features
- Offers log management and error tracking
- Compatibility with Docker and StatsD enables streamlined collection and transmission of data
- Supports with PHP, .NET, Java, and Python
- Offers more than 700 integrations
- Offers WordPress-specific functionality
- Provides insights into metrics like error rate, cross-application tracing, and response time
- Native support for OpenTelemetry
Pricing
New Relic calculates price by considering data ingested and the type of users. It offers four plans: free, standard, pro, and enterprise. You can contact their customer care to know more about the pricing.
5. Dynatrace
Dynatrace is another popular observability platform that provides insights into the performance of software, infrastructure, and applications. Davis's AI engine enables quick anomaly detection and root cause analysis.
It offers features like application observability, infrastructure observability, security analytics, and automation.
Features
- Enables you to analyze application performance with users
- Allows you to add digital experience and business analytics functionality
- Offered as SaaS and on-premises
- Provides code-level tracing for better production quality
- Supports 600+ integrations
- Provides automated context and causation through Dynatrace Grail
Pricing
Dynatrace has six pricing plans depending on the product you choose. For example, full-stack monitoring costs $0.08 per hour for an 8 GB host.
4. How can retailers deliver goods securely in an expanding and complex supply chain ecosystem?
Delivering goods securely is no longer just about getting products from the warehouse to the customer's doorstep; it's so much more. You need end-to-end visibility to securely deliver goods in today's complex supply chain ecosystem.
You need a clear view of your entire supply chain, from raw material suppliers to delivery partners. Further, the increased digitization of supply operations has led to an increased significance of security. You have to implement robust cybersecurity measures that protect all sensitive information.
With advanced tracking and monitoring systems, you can quickly achieve this visibility and identify vulnerabilities. Most observability platforms in this list offer excellent monitoring and exceptional security measures.
Conclusion
Holidays are a significant time for everyone. It is time for businesses to shine and acquire and retain customers. However, with inadequate monitoring of their IT infrastructure, it can be challenging to manage the traffic and deliver a seamless experience.
Observability platforms are essential to ensuring holidays can be successful for businesses and people. They ensure your IT infrastructure remains robust and responsive by providing rigorous and real-time monitoring.


Leave a Reply